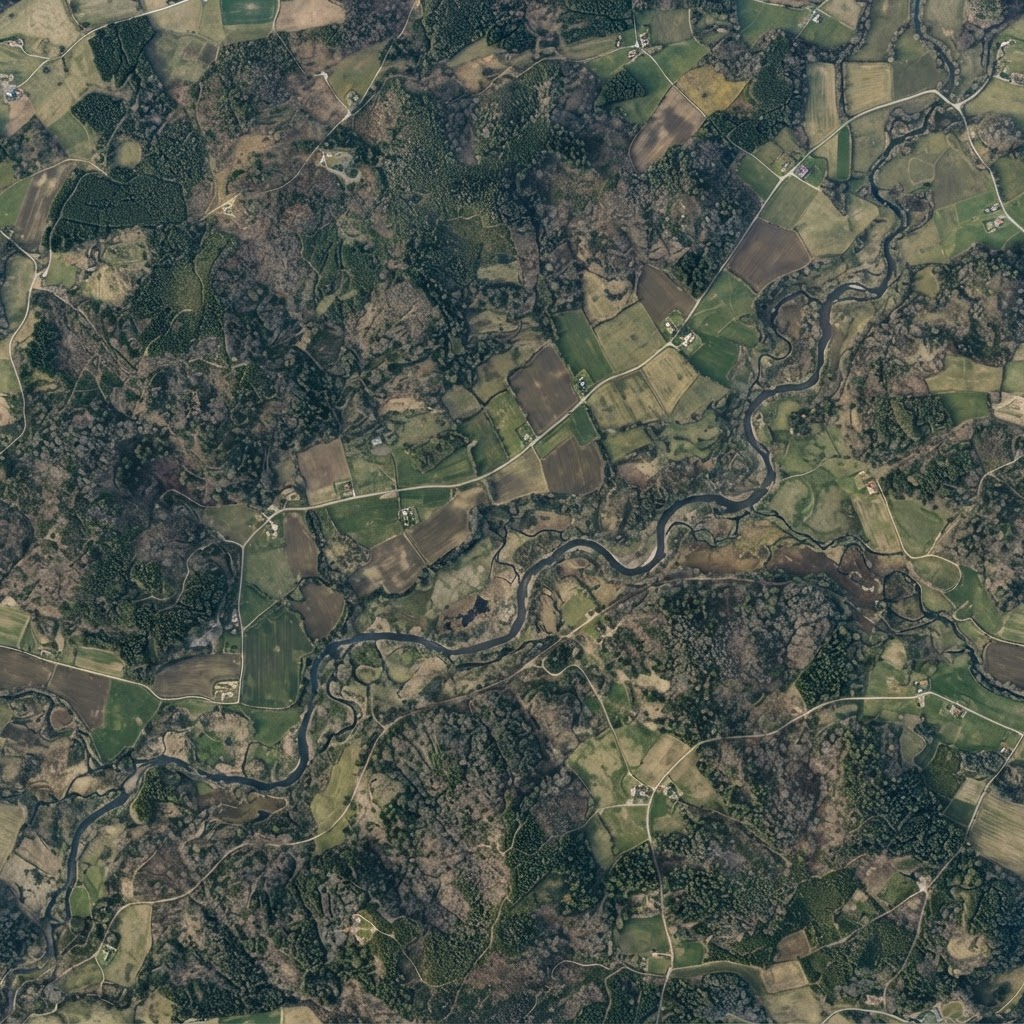
01 — Map
Define the site
Map and define geographical project boundaries with precision.
Geospatial Environmental Intelligence
Turn geographical and environmental data into actionable insights for carbon and biodiversity projects.
Every environmental project starts with a place. Darukaa.Earth connects that place with the data needed to understand what is happening on the ground.
Map and define geographical project boundaries with precision.
Bring geographical and environmental information together around each project site.
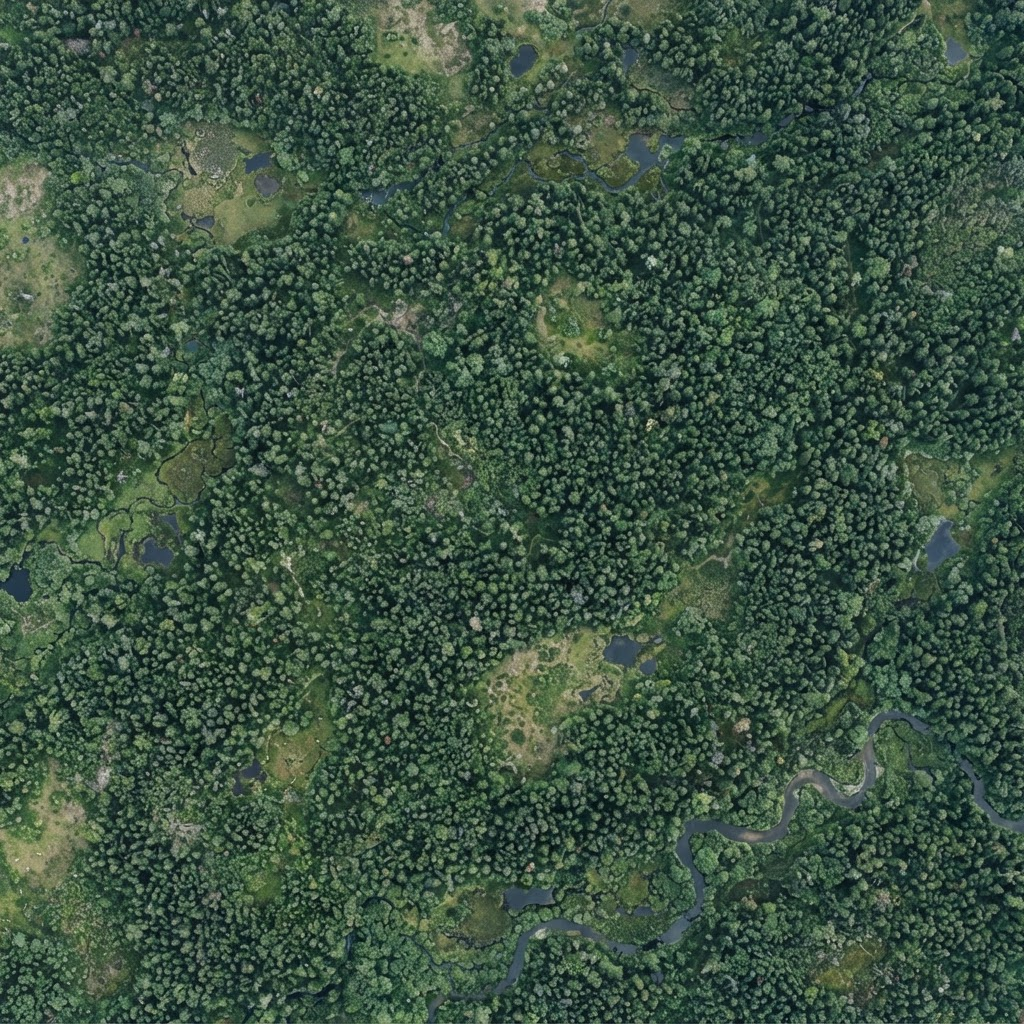
Turn environmental measurements into clear insights and trends over time.
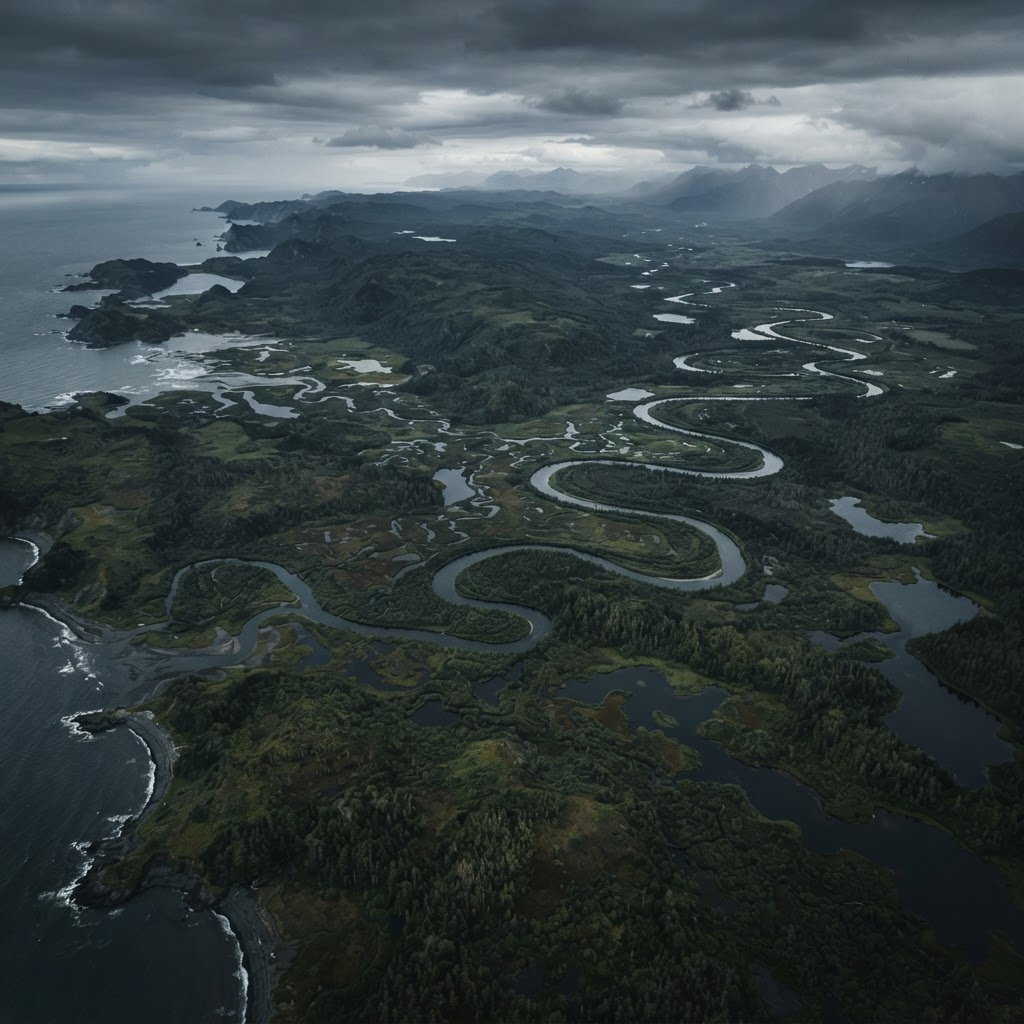
Visualize environmental projects across the landscapes where they exist.
1,248 ha
Environmental monitoring
Illustrative preview — values shown are demo data
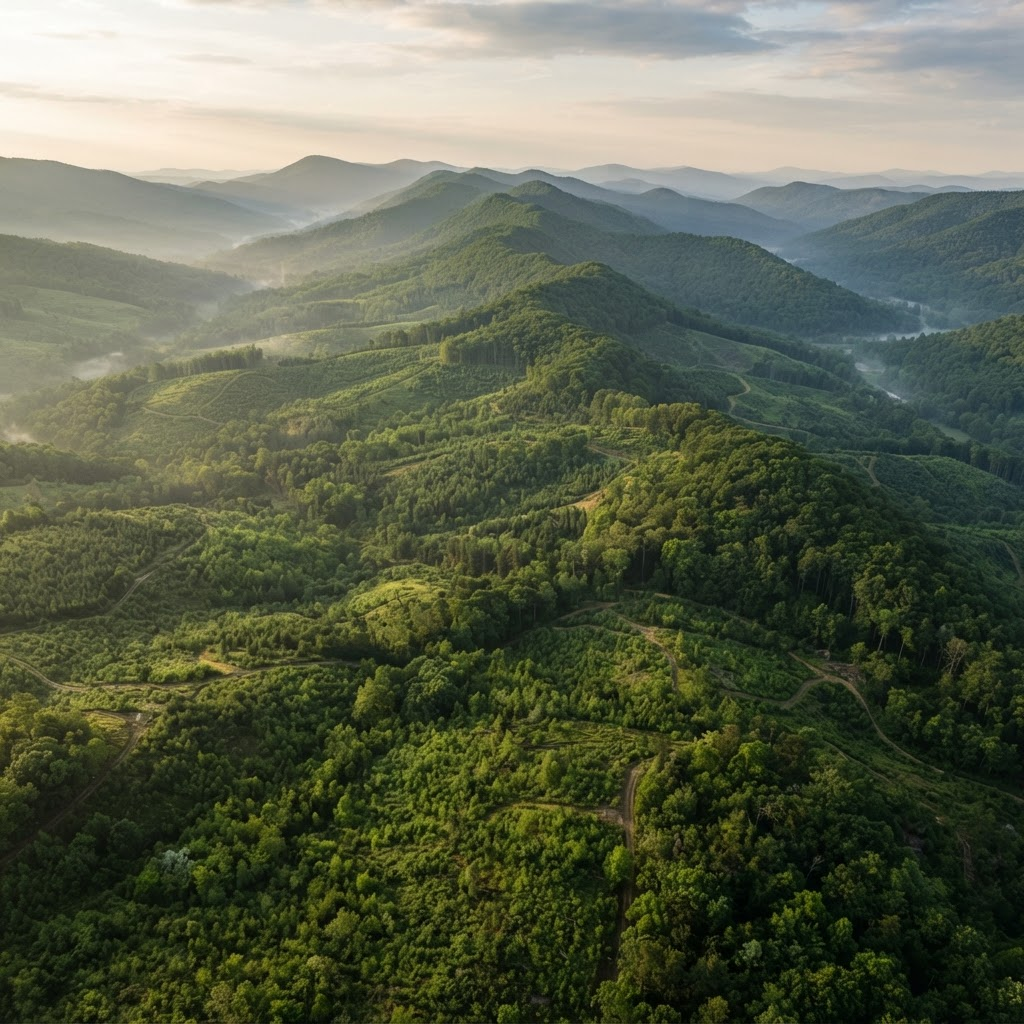
Understand how environmental conditions change across project sites through structured monitoring and historical data.
Connect biodiversity observations and geographical information to understand ecological activity across project sites.
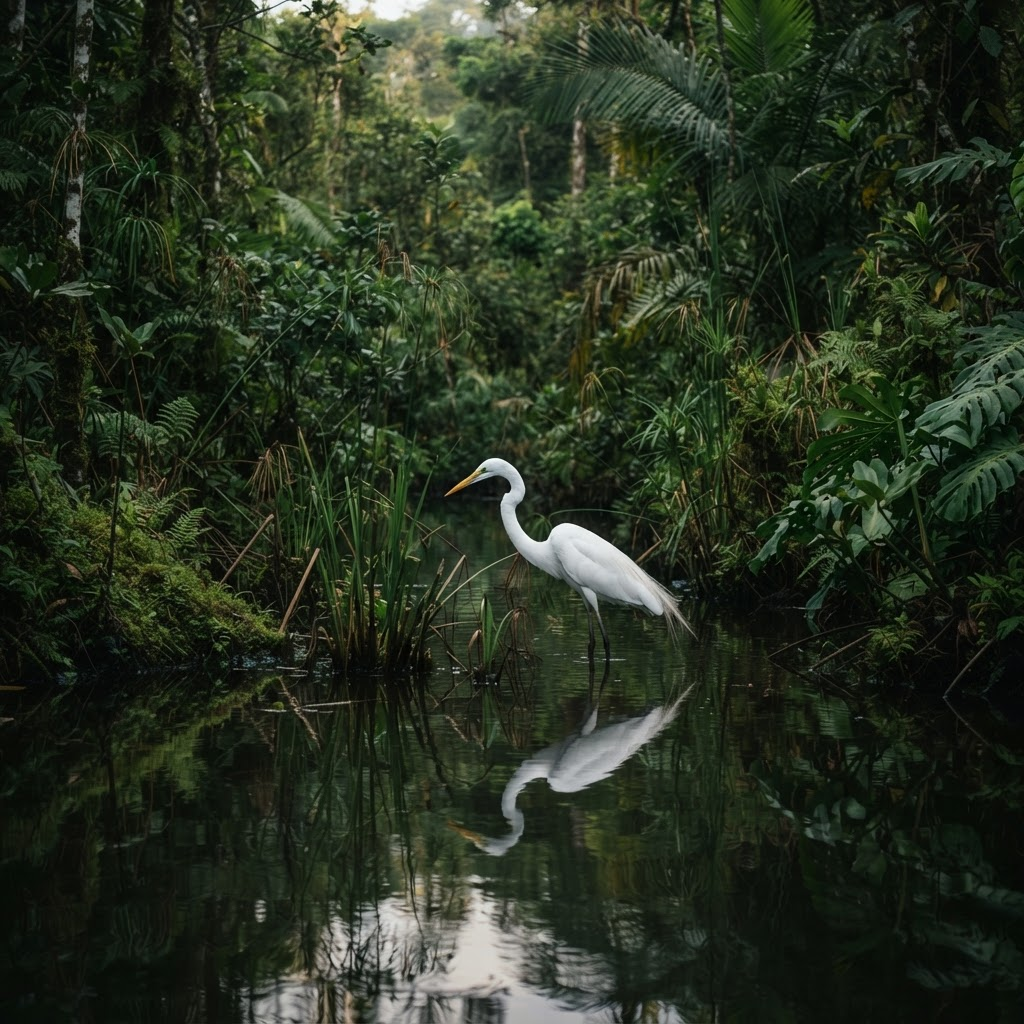
1,248ha
Across 3 monitored sites
36
Recorded across project sites
Interface preview — all values are illustrative demo data
Create a project and define its geographical sites.
Draw and visualize site boundaries.
Connect environmental information to each geographical site.
Understand environmental performance and changes over time.
Environmental projects exist across landscapes, ecosystems, and borders. Understand them through a common geographical lens.
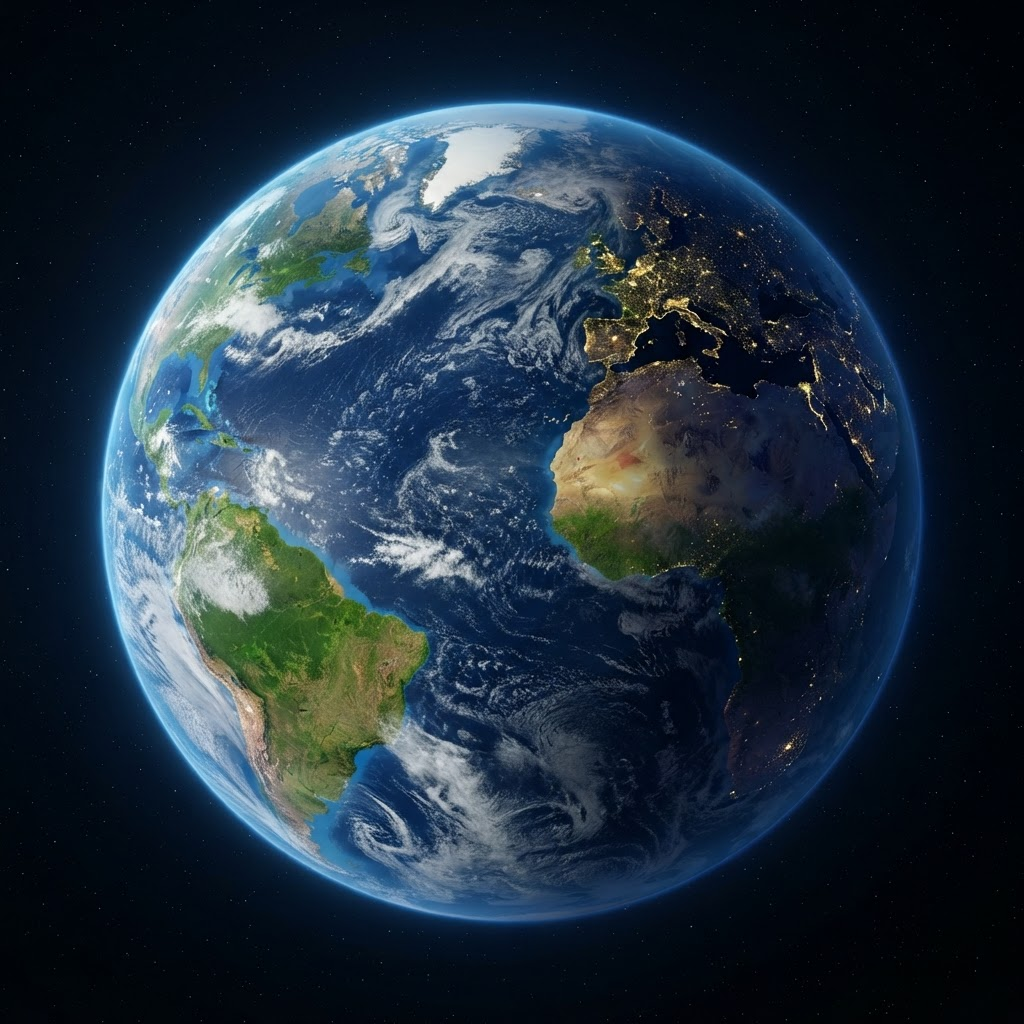
Illustrative representation — not indicative of current operations
Explore a more connected way to understand carbon and biodiversity projects.